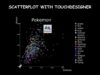
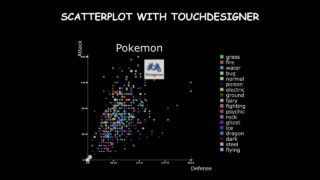
TouchDesigner Scatterplot – p.7 Workshop: Interactivity
In this series of videos I show how to create a scatterplot with Touchdesigner, using a Pokemon dataset from Kaggle. It focuses on the engineering/automation side: how to create custom automated parameter to control the scatterplot from the top level (size, data, colors, labels, etc…)
📌 Resources & Links:
Gitlab repository:
https://gitlab.com/tommella901/Touchdesigner-for-Datavisualization-SCATTERPLOT-WORKSHOP
🐱 Download Pokemon sprites here:
https://gitlab.com/tommella901/Touchdesigner-for-Datavisualization-SCATTERPLOT-WORKSHOP/-/raw/main/data/pokemon/sprites.zip?ref_type=heads&inline=false
Part 0: Intro
Part 1: Cartesian axes
Part 2: Thicks
Part 3: Title and Labels
Part 4: Main plot (dots, colors, background, etc…)
Part 5: Intro to Extensions
Part 6: Automate parameters
Part 7: Add interactivity
Part 8: Add categorical color (and automate)
Part 9: Legend
Part 10: Save with extension
In the repository, you can find each .toe file for each video, which you can use as a checkpoint and start from there.
P.s. This is my first video series, be kind and any suggestion is appreciated, much love 👵🏻