Mapping 2125: Predicting Future Population with Python & TouchDesigner | #30DayMapChallenge (12/30)
How will the world look in 100 years?
For Day 12 of this year’s #30DayMapChallenge (theme: Map from 2125), I tried to figure out what the surface of the Earth will look like, in terms of global population density, a century from now – using real data, code, and a bit of creative speculation – and then turned it into my very first #TouchDesigner visualization.
Starting from 50 years of historical GHSL population data, I mapped everything into a global grid of Uber H3 hexagons, then used a simple linear regression model to project population change forward to the year 2125. Sure – it’s not the most scientifically precise forecast, but it’s a fun way to explore how spatial modeling and hex-based data aggregation can reveal long-term patterns at a global scale
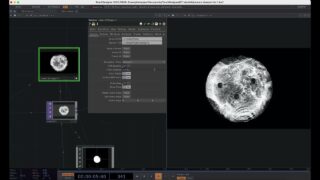
As for the base map, I used a custom one (also for the first time), sourced from NASAl, and for the very first time, I brought the results to life with a TouchDesigner 3D animation – turning the data into a cinematic map of our potential future.
This one’s less about prediction accuracy, rather, possible vision and the potential of spatial data science.
Code: https://open.substack.com/pub/milanjanosov/p/mapping-2125-predicting-future-population?r=3o5qdz&utm_campaign=post&utm_medium=web&showWelcomeOnShare=true
#30DayMapChallenge #FutureMaps #PopulationProjection #PythonMapping #DataVisualization #Geospatial #H3Hexagons #NASAData #TouchDesigner #MapFrom2125 #Futurism #DataArt #GIS #spatialdata